2.10 VS Code
vscode-R is the R Extension for Visual Studio Code. The extension is mainly focused on providing language service based on static code analysis and user interactivity between VS Code and R sessions.
You can run R in VS Code. Simply open the folder containing your R scripts in VS Code, and then open the command palette (Cmd+Shift+P) and type “R: Create R terminal”. This will start an R session in the terminal.
- By default, this will close the currently open folder.
- If you want multiple windows each with their own folder, you first open a new window (
Ctrl+Shift+N) and then open the folder in that new window.
rstudioapi::restartSession() will restart the R session.
Command Palette, type “R: Interrupt R” to interrupt the current R session.
2.10.0.1 Keyboard shortcuts
| Shortcuts | Function |
|---|---|
cmd + / |
comment |
shift + cmd + M or shift + ctrl + M |
In script editor: user defined; %>% |
ctrl + P |
In Radian: user defined; %>% |
opt + - |
user defined; <- |
ctrl + ` |
toggle btw editor and terminal |
For commonly used general keyboard shortcuts (not limited to R), see HERE.
Suggested keyboard shortcuts for R in VS Code.
For user defined shortcuts, you can add them in the
keybindings.jsonfile.
Q: How to run R code interactively?
A: Create an R terminal via command R: Create R Terminal in the Command Palette. Once an R terminal is ready, you could either select the code or put the cursor at the beginning or ending of the code you want to run, press (Ctrl + Enter), and then code will be sent to the active R terminal.
If you want to run an entire R file, open the file in the editor, and press Ctrl+Shift+S and the file will be sourced in the active R terminal.
Q: Why using VS Code for R programming instead of RStudio?
A: Several reasons:
- Better integration with Copilot, making it easier to write code with AI assistance.
- More responsive and powerful engineering tools such as symbol highlight, find references, rename symbol, etc. integrated to the IDE.
- VS Code has a lot of extensions that can enhance your R programming experience, such as
Markdown Preview Enhance,Live Server, andGitLens. - Git support is better in VS Code, making it easier for version control and collaboration.
2.10.1 languageserver package
The R language server implements the Language Server Protocol (LSP) and provides a set of language analysis features such as completion, providing function signatures, extended function documentation, locating function implementations, occurrences of a symbol or object, rename symbol, and code diagnostics and formatting. The R language server statically analyzes R code, and vscode-R interfaces with it to provide the core of this extension’s functionality.
The R language server is implemented by the languageserver package which performs static code analysis with the latest user documents in R and Rmd languages. Therefore, it does not rely on an active R session and thus does not require the code to be executed.
2.10.1.1 Highlight Features:
stylerThe language server provides code formatting through the through the
stylerpackage in R. See here for configuration.Main usage: select the code block you want to format, right-click and select Format Selection. Note that this only works in the Edit Mode when Vim is enabled.
Alternatively, right-click at anywhere in the code editor and select Format Document to format the entire document.
Rename symbols
Place the cursor on the symbol you want to rename, right-click and select Rename Symbol. A dialog will pop up, allowing you to enter the new name for the symbol. A refactoring preview will be shown, allowing you to review the changes before applying them.
Find References
Right-click on an R object,
select Find All References to find all references to the object in the current workspace.
The results will be shown in the References view in the Activity Bar on the left side of the window.
select Go To References open a popup showing all of the uses of the object within the current document.
2.10.1.2 lintr
R code linting (diagnostics) is provided by lintr via language server and is enabled by default. It provides syntax error warnings as well as style guidelines.
Configuration
To configure the behavior of lintr, you should create/edit the global lintr config file at ~/.lintr. Alternatively, you can also create/edit a project-specific lintr config file at ${workspaceFolder}/.lintr.
Do not forget the new empty line at the end of the file.
To be sure that the file is correctly set up you can use:
If the file is not available in the workspace you can add it with:
You can also add this line in your
.Rprofileto not have to run it everytime. ref ↩︎Visit Individual linters for a complete list of supported linters.
Visit the Configuring linters for a complete guide to customizing lintr config regarding the list of linters and file or line exclusions.
Q: How to disable lintr?
A: Set "r.lsp.diagnostics": false. Then in command palette, type “Developer: Reload Window” for the changes to take effect.
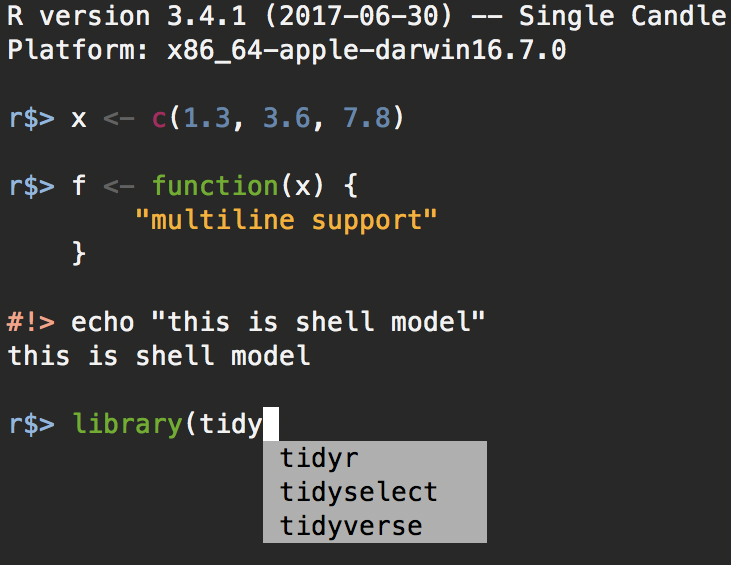
2.10.2 Radian
Q: There is no syntax highlighting in the R terminal. How to fix it?
A: Install Radian, an improved R console REPL interface that corrects many limitations of the official R terminal and supports many features such as syntax highlighting and auto-completion.
Q: How to install Radian?
A: In the terminal, run
$pipx install radian
  installed package radian 0.6.15, installed using Python 3.13.5
  These apps are now globally available
    - radian
⚠️  Note: '/Users/menghan/.local/bin' is not on your PATH environment variable. These apps will not be globally
    accessible until your PATH is updated. Run `pipx ensurepath` to automatically add it, or manually modify your PATH in
    your shell's config file (e.g. ~/.bashrc).
done! ✨ 🌟 ✨

$pipx ensurepath

/Users/menghan/.local/bin has been been added to PATH, but you need to open a new terminal or re-login for this PATH
    change to take effect. Alternatively, you can source your shell's config file with e.g. 'source ~/.bashrc'.

You will need to open a new terminal or re-login for the PATH changes to take effect. Alternatively, you can source your
shell's config file with e.g. 'source ~/.bashrc'.
N.B. If you have zsh as your shell, you need to run source ~/.zshrc instead of source ~/.bashrc.
To find where radian is installed, you can run:
This is the path to the radian executable.
After adding Radian to your PATH, you can invoke it in the terminal by simply typing radian.
$radian
R version 4.3.1 (2023-06-16) -- "Beagle Scouts"
Platform: aarch64-apple-darwin20 (64-bit)

r$>
Then, in VS Code, you will need to set Radian as the default R terminal. You can also configure other settings for R.
{
  "r.rterm.mac": "/Users/menghan/.local/bin/radian",
  "r.bracketedPaste": true,
  "r.sessionWatcher": true,
}r.rterm.mac: Path to the Radian executable.r.bracketedPaste: Enables bracketed paste mode, which allows pasting code without executing it immediately. This is useful if you want to paste multiple lines of code into the console at once.r.sessionWatcher: Enables session watcher to monitor the R session. Specifically,- Show value of session symbols on hover
- Show plot output on update and plot history
- Show htmlwidgets, documentation and shiny apps in WebView
r.alwaysUseActiveTerminal: always send code to active terminal rather thanvscode-R; helps me to start an R session which is terminated when VSCode exits.r.plot.useHttpgd: Use the httpgd package for viewing plots in a VS Code window or in the browser.
See Extension Settings for a full list of settings of vscode-R that can be set in VSCode’s settings.json file.
2.10.2.1 Configuration
radian can be customized by specifying the below options in various locations:
$HOME/.config/radian/profile.radian_profilein the working directory
Example of a radian profile
# either  `"emacs"` (default) or `"vi"`.
options(radian.editing_mode = "vi")

# enable various emacs bindings in vi insert mode
options(radian.emacs_bindings_in_vi_insert_mode = TRUE)

# show vi mode state when radian.editing_mode is `vi`
options(radian.show_vi_mode_prompt = TRUE)
options(radian.vi_mode_prompt = "\033[0;34m[{}]\033[0m ")

# custom key bindings
options(
    radian.escape_key_map = list(
        list(key = "-", value = " <- "),
    ),
    radian.ctrl_key_map = list(
        list(key = "p", value = " %>% ")
    )
)
Insert pipe operator
%>%by pressingCtrl+PInsert assignment operator
<-by pressingEsc+-But this does not work when Vim is enabled as it interferes with Vim’s normal mode.
VI support by radian:
options(radian.editing_mode = "vi"): set the default editing mode to vi.options(radian.show_vi_mode_prompt = TRUE): This option will show the current vi mode in the prompt when usingradianin vi mode. The prompt will be colored blue and will display the current mode.[ins]: insert mode[nav]: normal mode
2.10.3 FAQ
Q: I cannot see my R Objects in the global environment.
A: when you click on “R: (not attached)” on the bottom bar or type .vsc.attach() into the terminal, your objects should start showing up in your global environment.
Q: How to hide variables in OUTLINE view?
A: OUTLINE view by default shows all variables in the current R script, making it difficult to locate your true sections. To hide variables, go to command palette, type “Outline: Show”, there is a list of objects that you can choose to show or hide (you can choose to set this for workspace or the user). Here is my current setting:
{
  "outline.showArrays": false,
  "outline.showBooleans": false,
  "outline.showClasses": true,
  "outline.showConstants": false,
  "outline.showFields": false // this hides most variables you actually don't want to see
}
Note that some answers mention that you should use
"outline.showVariables": false, but this does NOT work for me. Instead, I use"outline.showFields": falseto hide most variables.
To set outline appearance for a specific language, you can use the following settings:
{
  "[r]": {
    "outline.showArrays": false,
    "outline.showBooleans": false,
    "outline.showClasses": true,
    "outline.showConstants": false,
    "outline.showFields": false
  },
  "[rmd]": {
    "outline.showKeys": false,
  }
}- Set
outline.showKeysto false will prevent code chunks from being shown in the OUTLINE view of Rmd files.
Multiple language specific editor settings
You can now configure language specific editor settings for multiple languages at once. The following example shows how you can customize settings for javascript and typescript languages together in your settings.json file:
See HERE for a complete list of icons and their meanings in the OUTLINE view.
The following tables shows the icons that you most commonly see in the OUTLINE view.
| Icon | Name | Symbol type |
|---|---|---|
| Methods and Functions |
method, function, constructor
|
|
| Variables |
variable
|
|
| Fields |
field
|
|
| Words |
text
|
|
| Constants |
constant
|
|
| Classes |
class
|
|
| Structures |
struct
|
|
| Modules |
module
|
|
| Properties and Attributes |
property
|
- Constant applies to Quarto sections. Need to set
"outline.showConstants": true,to show sections properly in the OUTLINE view.
2.10.4 Plot Viewer
httpgd: A graphics device for R that is accessible via network protocols. This package was created to make it easier to embed live R graphics in integrated development environments and other applications. httpgd is required by the interactive plot viewer of the R extension for VS Code.
Enable r.plot.useHttpgd in VS Code settings.
r.plot.useHttpgd: use the httpgd-based plot viewer instead of the base VSCode-R plot viewer
This will allow you to view plots in a separate window or in the browser, which is useful for interactive visualizations.
The httpgd plot viewer supports
- auto-resizing,
- light/dark theme mode,
- plot history,
- hiding and zooming.
Getting started with httpgd
library(httpgd)
# Start the httpgd graphics device
hgd()

# Open the plot viewer in your browser
hgd_browse()

# Create a figure
x = seq(0, 3 * pi, by = 0.1)
plot(x, sin(x), type = "l")
Q: Plot viewer is missing.
A: Run hgd() in R and get the url to the viewer. Use the command palette to run “R Plot: Open httpgd Url”. It will let you enter the url address, fill it in and hit Enter to open the plot viewer. Alternatively, if you want to view in external browser, you can copy the url and paste it in your browser.
hgdInitialize device and start server.hgd_browseOpen the plot viewer in your browser, can be internal or external.When you call
hgd_browse(), it will open the graphic device in a new tab in your default web browser. You wil see the path to the viewer in the R console.You may copy and paste the url to your external browser.
There is an url in the tab header to indicate it is a web browser. When you hover over the image, the menu bar will show up. You can choose to download, copy, clear all plots, etc.
hgd_close()will clear all plots.Note that this will NOT close the viewer automatically for you. You can close the viewer manually by clicking the “x” button on the top right corner of the viewer window.
By the next time you call
plot, you will see all historical plots are gone.Closing the plot viewer window does not clear the plots, nor clearing the plots closes the plot viewer window.
If you don’t call
hgd_close(), but click the “x” button on the top right corner of the viewer window, the viewer will be closed but all historical plots are still there. You can callplotagain to see the previous plots.Otherwise, if you click the “x” button directly, the viewer will be closed, but all historical plots are still there. You can call
plotagain to see the previous plots.Keyboard shortcut in the WebView
←/→/↑/↓: navigate through the plot history
+/-: zoom in/out0: reset zooms/p: save the current plot as SVG/PNGNot recommended to save as PNG as the resolution is low.
Use
ggsave("plot.png", dpi = 300)instead to save high-resolution plots.
Universal graphics device (unigd) is a package that provides a set of functions to manage the plot viewer, such as:
unigd::ugd_clear()Clear all pages in the plot viewer.Same effects as
hgd_close().unigd::ugd_remove(page = 2)Remove the second page.
Ref:
2.10.6 Emulating rstudioapi functions
The VSCode-R extension is compatible with a subset of RStudio Addins via an {rstudioapi} emulation layer. Nearly all of the document inspection and manipulation API is supported, allowing RStudio add-ins and packages that rely on rstudioapi to function within VS Code.
This emulation is achieved by “duck punching” or “monkey patching” the
rstudioapifunctions within the R session running in VS Code. This means the originalrstudioapifunctions are replaced with custom implementations that communicate with VS Code instead of RStudio.To enable RStudio Addins, you may need to add
options(vsc.rstudioapi = TRUE)to your~/.Rprofilefile. This ensures therstudioapiemulation is loaded when your R session starts.getOption("vsc.rstudioapi")will returnTRUEif the emulation is enabled.
Use RStudio Addins from VS Code
How to use your RStudio Addins in VS Code after enabling the emulation:
- Use the command palette (
Ctrl+Shift+P) and type “R: Launch RStudio Addin”. - You will see a list of available RStudio add-ins that you can run directly from VS Code.
- Choose the add-in you want to run, and it will execute in the current R session.
You can also bind a keyboard shortcut to launch the RStudio Addin picker (command id: r.launchAddinPicker):
{
    "key": "ctrl+shift+A",  // launch RStudio Addin
    "command": "r.launchAddinPicker",
    "when": "editorTextFocus && (editorLangId == 'markdown' || editorLangId == 'r' || editorLangId == 'rmd' || editorLangId == 'quarto')"
},
This will allow you to quickly access and run RStudio add-ins without needing to open the command palette each time.
To launch a specific RStudio addin, you can map a direct keybinding to the addin R functions.
- The function can be found in
inst/rstudion/addins.dcffile of the addin-providing-package’s source.- Look for the keyword
Bindingin the file to find the function name. - The package name is the repository name of the addin-providing package.
- Look for the keyword
Use example: Here I want to invoke two RStudio addins: shoRtcut::set_new_chapter() and shoRtcut2::set_new_chapter2().
Add the following keybindings to your keybindings.json file:
{
  "description": "Pad line with dashes",
  "key": "ctrl+shift+S",
  "command": "r.runCommand",
  "when": "editorTextFocus && (editorLangId == 'markdown' || editorLangId == 'r' || editorLangId == 'rmd' || editorLangId == 'quarto')",
  "args": "shoRtcut:::set_new_chapter()"
},
{
  "description": "Pad line with equals",
  "key": "ctrl+shift+=",
  "command": "r.runCommand",
  "when": "editorTextFocus && (editorLangId == 'markdown' || editorLangId == 'r' || editorLangId == 'rmd' || editorLangId == 'quarto')",
  "args": "shoRtcut2:::set_new_chapter2()"
},
Now you can use
Ctrl+Shift+Sto pad a line with dashes, andCtrl+Shift+=to pad a line with equals.
ref: RStudio addin support in VSCode-R
2.10.7 Work with Rmd
You can edit Rmd with either of the two Language Modes:
R Markdown: there is a knit button to provide preview but no live preview.If using RStudio, you can only get a preview after rendering
- Render the site using:
rmarkdown::render_site()function, which can be slow for large sites. - Render the document using:
rmarkdown::render("0103-RStudio-VSCode.Rmd")function, which is equivalent to clicking the “Knit” button in RStudio.
Note that
- Knit button generate output html in the
docs/directory; it uses your styles settings in the_output.ymlfile. rmarkdown::rendergenerates output html in the same directory as the Rmd file. It does not apply any settings from_output.ymlfile, so you need to specify any headers you want to load, e.g., mathjax macros.
How to decide which Language Mode to use? A rule of thumb is:
If your Rmd has lots of R code you need to run interactively, use
R Markdown.If you want to write a static report with minimal R code, use
Markdown.At all cases, it is quite easy to switch between the two modes by changing the Language Mode in the bottom right corner of VS Code. So you can choose either one that suits you best.
- Render the site using:
Markdown: there is no knit button but you can have a live preview using theMarkdown Preview Enhanceextension.Instead, you need to type the command
rmarkdown::render()in the R console or in an R script to render the Rmd file.
2.10.7.1 Render book
Render the site rmarkdown::render_site(input = ".", output_format = "all")
rmarkdown::render_site()without arguments will render all formats by default.- specify
output_formatto render a specific format, e.g.,bookdown::gitbook,bookdown::pdf_book, etc.
# Render the site, equivalent to clicking the "Build Book" button in RStudio
# All output formats specified in the `_output.yml` file will be rendered.
rmarkdown::render_site()
# Render a specific output format, e.g., bookdown::gitbook
rmarkdown::render_site(output_format = 'bookdown::gitbook')
Render a single document has two options:
rmarkdown::render_site(file_name)looks for the_output.ymlfile in the root directory of the site and applies the settings specified in that file. See HERE for more details.Recommended for its automatic formatting. ✅
rmarkdown::render(input, output_format = NULL)renders any single Rmd file without applying any settings from_output.ymlfile. See HERE for more details.You need to specify any headers you want to load, e.g., mathjax macros. More hassle → less recommended.
# Render the document, equivalent to clicking the "Knit" button in RStudio
# This will apply any global settings for your website and generate the output html in the `docs/` directory.
rmarkdown::render_site("0103-RStudio-VSCode.Rmd")

# Render a single Rmd file
rmarkdown::render("0103-RStudio-VSCode.Rmd")
2.10.7.2 View book
To view the static site in the docs/ directory. I installed the VSCode extension Live Preview. All I need to do is select one of the .html files, right-click the preview button in the code editor, and there it is. I can also just navigate to http://127.0.0.1:3000/docs/ in my browser. It even updates as I add chapters and redo the render_site() command.
If Live Preview is not loading the latest changes, try “Developer: Reload Window” in the command palette.
A most reliable way is just to open the
docs/xxx.htmlfile in your browser. This way, not only will it open the file you clicked, but it will also open the entire site.An additional benefit is that your site won’t blink when you make changes or build the site. I found the constant blinking of the Live Preview blinding.
Using static files, you simply refresh the browser every time you rebuild the site.
ref
2.10.8 Extensions
R Tools provides support for the R language, including syntax checking, completions, code formatting, formatting as you type, tooltips, linting.
Open the Command Palette and type ‘R:’ to see list of available commands and shortcuts.
2.10.9 Jupyter Notebooks
Jupyter (formerly IPython Notebook) is an open-source project that lets you easily combine Markdown text and executable Python source code on one canvas called a notebook. It provides an interactive environment where you can write and execute code, visualize data, and document your analysis all in one place.
It sounds like R Markdown.
One distinction is that R Markdown runs code in R console, while Jupyter notebook runs code in its own kernel.
Jupyter can provide individual environments for each notebook, making it easier to manage dependencies and avoid conflicts between different projects. → But probably, it’s easier just to use the system R kernel as you don’t need to install packages in each environment.
- You can use
conda installto manage packages in each independent environment.
- You can use
Magic commands
This can be used to run code in different languages within the same notebook. For example, you can use the
%%Rmagic command to run R code in a Python notebook, or the%%pythonmagic command to run Python code in an R notebook.There are many other magic commands available, such as
%%bashto run shell commands,%%timeto time the execution of a cell, and%%cdto change the current working directory.Online services
You may have web-based access to Jupyter notebooks via services such as Google Colab, JupyterHub and Open OnDemand.
You can convert Jupyter notebooks to Quarto qmd format:
This is nice in part because qmd (like Rmd) is more easily handled by version control and with shell commands than the JSON format of
.ipynbfiles.
Tutorial:
-
repris a package that provides rich representations for R objects in Jupyter notebooks. It allows you to customize how R objects are displayed in the notebook, including options for controlling the size and format of plots, tables, and other output.
Install IRkernel
- Note this needs to be run in the R terminal or Radian (running in RStudio does not work).
IRkernel::installspec()makes the R kernel available to Jupyter. It lets Jupyter to use the default system R kernel instead of the R provided by Anaconda.
Reload window. Open command palette and type “Jupyter: Create New Blank Notebook” to create a new Jupyter notebook.
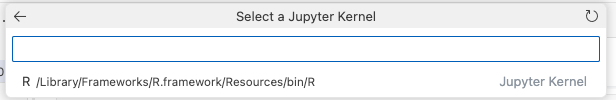
Click on the button right below ellipsis in upper right corner to choose kernel
Select Jupyter Kernels > R to use the R kernel.
It should look something like this:
2.10.10 Render Jupyter notebook
You can use quarto to convert Jupyter notebooks (.ipynb) to other formats such as HTML, PDF, or Markdown. It uses the document YAML to decide which format to convert to.
Note that when rendering an .ipynb Quarto will NOT execute the cells within the notebook by default (the presumption being that you already executed them while editing the notebook). If you want to execute the cells you can pass the --execute flag to render:
Path error when rendering .ipynb file with quarto --execute:
quarto render 07_Lab-2_dummy-variable.ipynb --execute --log-level=DEBUG
Quarto version: 1.7.31
projectContext: Found Quarto project in /Users/menghan/Library/CloudStorage/OneDrive-Norduniversitet/FIN5005 2025Fall/course_web
Loaded deno-dom-native
[execProcess] python /Applications/quarto/share/capabilities/jupyter.py
[execProcess] Success: true, code: 0

Starting ir kernel...[execProcess] /Users/menghan/anaconda3/bin/python /Applications/quarto/share/jupyter/jupyter.py
[execProcess] Success: true, code: 0
ERROR:

path
[NotebookContext]: Starting Cleanup
Not resolved…
2.10.10.1 Code cell modes
Three code modes in Jupyter notebooks:
Unselected: When no bar is visible, the cell is unselected.

Selected: When a cell is selected, it can be in command mode or in edit mode.
Command mode: solid vertical bar on the left side of the cell.
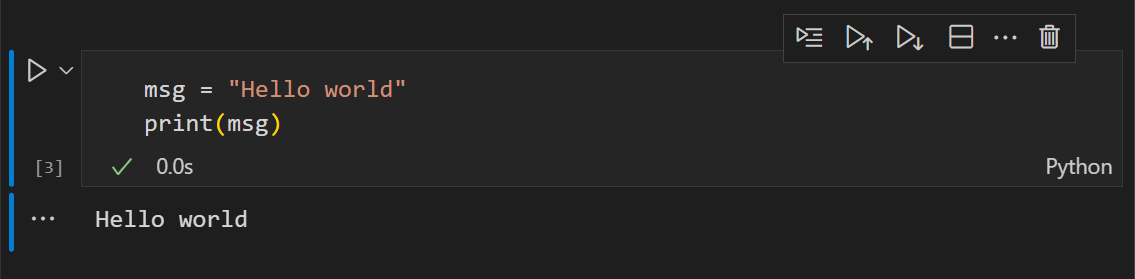 The cell can be operated on and accepts keyboard commands.
Hit Enter to enter edit mode, or click on the cell to enter edit mode.
Edit mode: a solid vertical bar is joined by a blue border around the cell input editor.
 Press Escape to return to command mode, or click outside the cell to return to command mode.
2.10.10.2 Keyboard shortcuts
Command Palette, type “Preferences: Open Keyboard Shortcuts” to open the keyboard shortcuts editor. You can search for “jupyter” to find all Jupyter-related commands and their shortcuts.
Run code cells
| Shortcut | Function |
|---|---|
Ctrl+Enter |
runs the currently selected cell; focus stays on the current cell |
Shift+Enter |
runs the currently selected cell and focus moves to new cell. |
Opt+Enter |
runs the currently selected cell and inserts a new cell immediately below (focus moves to new cell). |
| Run Cells Above | Command Palette, type “Notebook: Execute Above Cells” |
There is no executing current cell and moving focus to the next cell shortcut, you need to first run the current cell with Ctrl+Enter, then hit the down arrow key ↓ to move focus to the next cell.
I added one keyboard shortcut for this: cmd+Enter to run the current cell and move focus to the next cell. This works for both command mode and edit mode.
{
  "key": "cmd+enter",
  "command": "notebook.cell.executeAndSelectBelow",
  "when": "notebookEditorFocused"
}
Insert code cells
Under command mode (no thin blue border around the input cell, one thick vertical bar on the left):
| Shortcut | Function |
|---|---|
ctrl+; A |
Press Ctrl+;, release, then A.Insert a new code cell above the current one. |
ctrl+; B |
Add a new code cell below the selected one. |
Note: On my Mac, I just need to hit ESC to enter command mode, then A or B to insert a new cell above or below the current cell. No need to hit Ctrl+; first.
Change Cell to Code
| Shortcut | Function |
|---|---|
cmd mode: Y |
Change cell to code |
cmd mode: M |
Change cell to Markdown |
Miscellaneous
| Shortcut | Function |
|---|---|
ctrl+; X or dd |
Delete selected cells |
shift + ↑/↓ |
Select consecutive multiple cells |
L |
command mode; toggle line numbers |
R |
Undo last change |
ref:
2.10.10.3 Insert Image
The built-in image rendering in Jupyter notebooks is not very flexible. It renders images using the default width and height (about 50% of page width and almost square), which might be too large or too small for your needs, and very often, you want a specific aspect ratio.
Use IRdisplay to control plot size in Jupyter notebooks: ✅
generate the image and save it to a file, e.g.,
temp-plot.pnginsert a code cell and load the image using
IRdisplay::display_html()#| echo: false # Display the image with controlled width using HTML library(IRdisplay) display_html(paste0('<img src="', f_name, '" style="width: 70%; height: auto;">')) # center the image display_html(paste0('<div style="text-align: center;"><img src="', f_name, '" style="width: 70%; height: auto;"></div>'))
Alternatively, use markdown syntax
repr options
repr options are used to control the behavior of repr when not calling it directly. Use options(repr.* = ...)and getOption('repr.*') to set and get them, respectively.
Once repr package is loaded, all options are set to defaults which weren’t set beforehand.
repr.plot.*: representations of recordedplot instances
| Options | Descriptions |
|---|---|
repr.plot.width |
Plotting area width in inches (default: 7 in) |
repr.plot.height |
Plotting area height in inches (default: 7 in) |
repr.plot.pointsize |
Text height in pt (default: 12) |
repr.plot.res |
PPI for rasterization (default: 120) |
This works but is not ideal as the plot element is not adjusted proportionally. Text size is too large for the small plot and might be cropped. ❌
Other output representations
| Options | Descriptions |
|---|---|
repr.matrix.max.rows |
How many rows to display at max. Will insert a row with vertical ellipses to show elision. (default: 60 rows, first and last 30 rows) |
repr.matrix.max.cols |
How many cols to display at max. Will insert a column with horizontal ellipses to show elision. (default: 20) |
See repr CRAN for all available options.
2.10.10.4 View data frames
Jupyter Notebook comes with a built-in Data Viewer. Choose ‘Jupyter Variables’ in the menu bar on the top, if you don’t see it, click the ‘…’ button to find it. It will show you all the variables in the terminal panel.

Tou can double-click a variable to open it in the Data Viewer. It provides a spreadsheet-like interface to view the data.
You can filter, sort, and search the data in the Data Viewer.
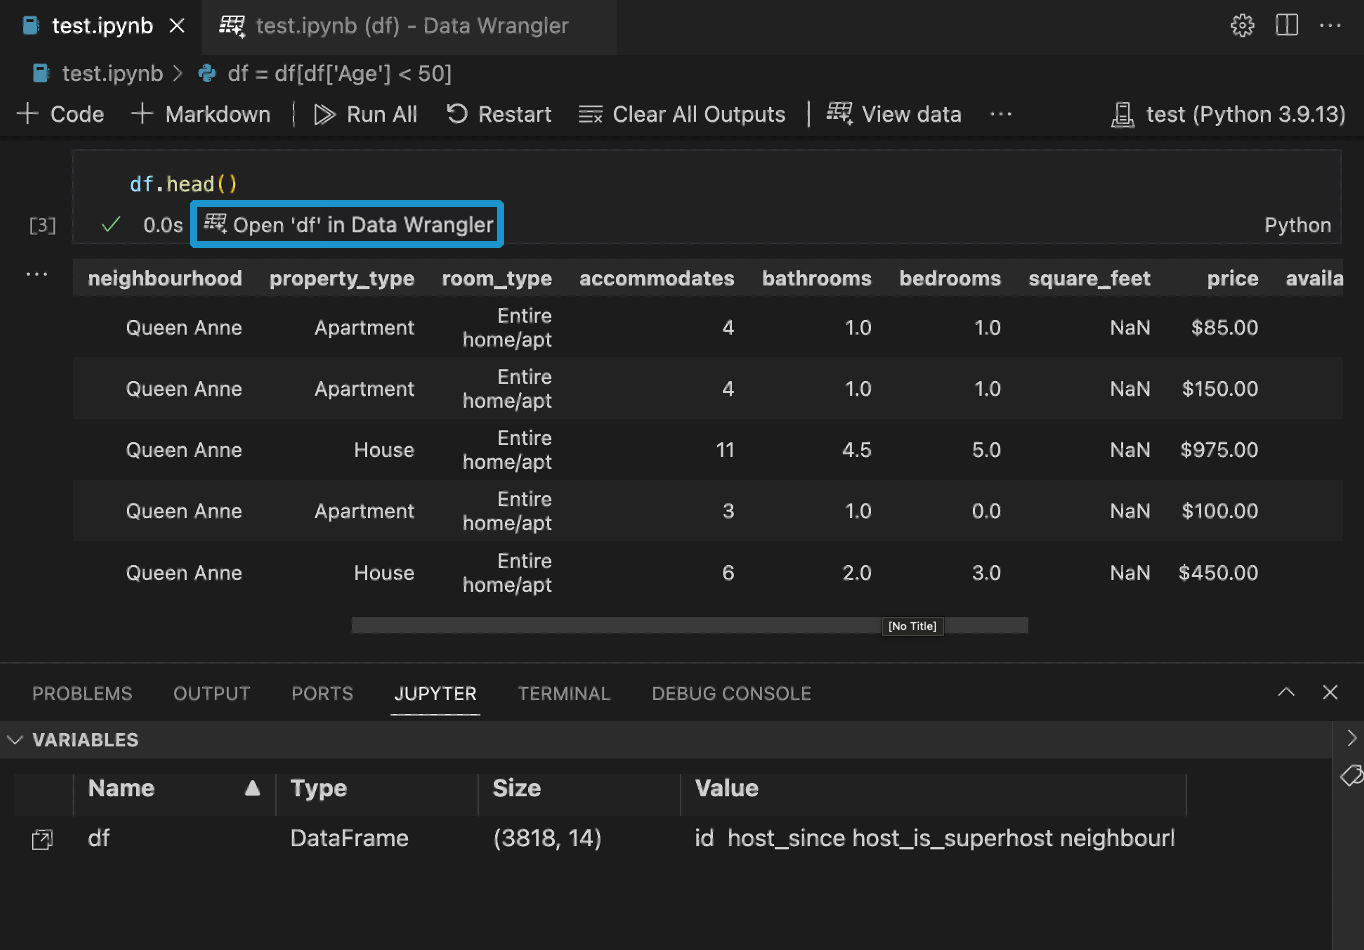
Data Wrangler
Use Data Wrangler extension to view data frames in a spreadsheet-like interface.
Launch Data Wrangler from a Jupyter Notebook
If you have a Pandas data frame in your notebook, you’ll now see an Open ‘df’ in Data Wrangler button (where df is the variable name of your data frame) appear in bottom of the cell after running any of df.head(), df.tail(), display(df), print(df), and df.
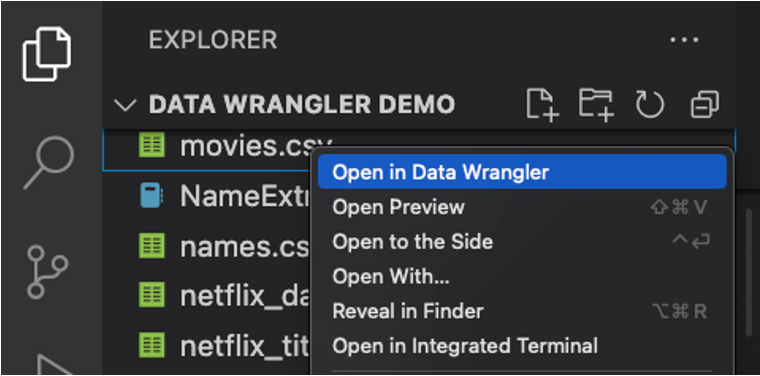
You can also launch Data Wrangler directly from a local file (such as a .csv). Right-click the file in the File Explorer and select Open in Data Wrangler.
ref: Quick Start Guide for Data Wrangler in VS Code
2.10.10.5 Export Jupyter notebook
You can export Jupyter notebooks to various formats, including Python scripts (.py), HTML, PDF, and more.
Refer to this post
The exported .py file will have “Run Cell”, “Run Below”, etc. This is due to # %% cell markers in the exported .py file. But they don’t interfere with the execution of the code in the .py file. Besides, I actually like these segmentation as they organize the code into sections and make it easier to run code in chunks. These features are useful when you run the .py file in an interactive window.
The trick part is you need to deal with the magic commands manually. .py files don’t support magic commands, so you need to remove them or replace them with equivalent python code.
2.10.11 Issues
Copilot Bug
Issue: Copilot suddenly suggests new edit, and cannot close Diff Editor.
The cell output
- not distinguishable from the code input
- text has a dark grey background color, which is hard to read.
You can customize your active Visual Studio Code color theme with the workbench.colorCustomizations and editor.tokenColorCustomizations user setting. E.g.,
workbench.colorCustomizations allows you to set the colors of VS Code UI elements such as list & trees (File Explorer, suggestions widget), diff editor, Activity Bar, notifications, scroll bar, split view, buttons, and more.
- For a list of all customizable colors, see the Theme Color Reference.
editor.tokenColorCustomizations allows you to set the colors of syntax highlighting in the source code editor, such as text, comments, keywords, strings, numbers, and more.
- Use the scope inspector tool to investigate what tokens are present in a source file.
- Syntax Highlight Guide for more information on how to customize syntax highlighting.
Developer Tools
Command Palette → type “Developer: Toggle Developer Tools”, this will open the Developer Tools window. It is useful for
- styling the VS Code UI, such as changing the colors of the text and background in the editor, or customizing the colors of the Jupyter notebook cells.
- debugging issues with VS Code, such as checking for errors in the console
2.10.12 FAQ
Q: How can I set a specific CRAN mirror permanently in R, so it won’t ask me again which mirror to choose?
A: Add the following line to your ~/.Rprofile file:
# add this line to ~/.Rprofile, restart your R session so it takes effect
> options(repos = c(CRAN = "https://mirror.accum.se/mirror/CRAN/"))
Restart your R session so it takes effect.
# to verify that CRAN mirror is set correctly
> getOption("repos")
                                  CRAN
"https://mirror.accum.se/mirror/CRAN/"
You can find a list of CRAN mirrors here. The principle is to choose a location close to you.
References:
- R in Visual Studio Code
- Set up
vscode-R: - Getting started with
httpgd: https://nx10.github.io/httpgd/articles/getting-started.html - Bookdown in VS code: https://www.bendirt.com/bookdown/
- Jupyter Notebooks in VS Code